Newspapers are the standard scholarly source of information about protest events. This motivated us to compare NSPE event characteristics to those from protests reported in the largest daily newspaper in each of the four major U.S. Census regions: the New York Times, Washington Post, Chicago Tribune, and Los Angeles Times. Focusing on the same period as the NSPE, 978 unique protest events were found from these newspapers. The figures below present results for our comparisons. Blue dots represent the NSPE and red dots the newspapers. Dots crossed out indicate a non-statistically-significant difference between the NSPE and newspaper data. Red dots further to the right than blue dots signal that the particular event characteristic appeared at a higher rate in newspaper reports relative to the NSPE; blue dots further to the right than red dots signal the reverse.
Starting with size, we see an enormous gap between the NSPE and newspapers. As revealed on the findings page, the average attendance for events in the NSPE was 61 protesters, while it was roughly 3,000 protestors in the newspaper data (see the figure below).
Newspapers vs Survey: All Events Size

Source: Sociological Methods and Research
Of the 37 other event characteristics analyzed, only 6 had greater representation in newspaper coverage of protests (top of the figure below): causes related to elections, religion, and racial issues, locations in the nation’s capital or in state capitals, and targets focused on local or state government. The bottom of the figure above shows that 10 event characteristics appeared more often in the NSPE: causes related to neighborhoods, abortion, drug policy, government, crime, healthcare, and human rights as well as the presence of police officers or counterdemonstrators.
Newspapers vs Survey: All Events

Source: Sociological Methods and Research
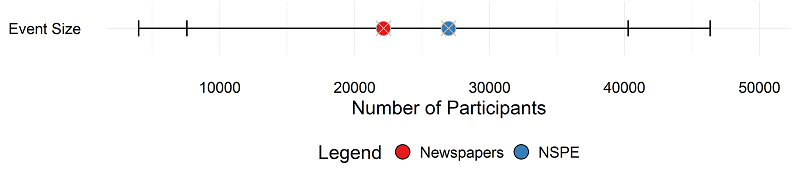
The figures below focus on the subset of events that appeared in both the NSPE and the newspapers. Doing so allowed us to assess how similar event characteristics from NSPE respondents were to those journalists reported for the same events. Unlike the figures from the comparisons for the full set of protests above, the majority of the dots are crossed out, indicating a general pattern of statistical non-significance. Among the 55 events the sources shared, we observe a null finding for size, for one.
Newspapers vs Survey: Matched Events Size
Source: Sociological Methods and Research
As the next figure shows, non-significant differences were also found for targets and all but a few causes. That similar numbers were found for most event characteristics the sources shared increases confidence in the validity of information collected from both NSPE respondents and journalists. Widespread discrepancies in event characteristics for the same protests would have raised doubts about the accuracy of each source's information.
Newspapers vs Survey: Matched Events

Source: Sociological Methods and Research
When statistically-significant differences were identified, they always favored the NSPE since blue dots were further to the right than were red dots (see bottom of the figure above). In other words, for identical protests, NSPE participants were more likely to report the presence of such event characteristics as a neighborhood-related cause, sponsoring organization, counterdemonstrators, and police officers than were journalists on the scene. That these participants always provided more information about the same events should not be surprising since they completed a detailed survey about the protest they attended and were not subject to journalistic constraints, including writing about “newsworthy” features of events and story word-count limitations.